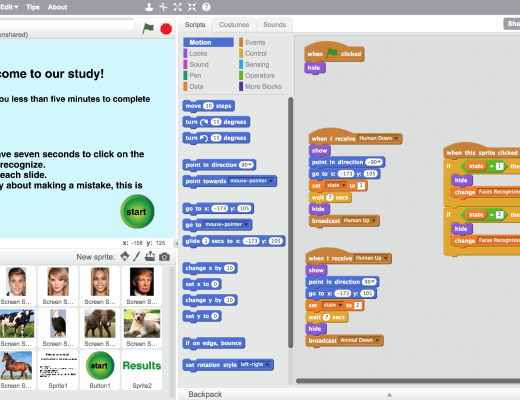
In the world of cognitive science, one thing is certain: we know very little about how our brains work. But through conducting studies and observing […] Read More
KTBYTE Computer Science Academy
Computer Science Education Blog

In the world of cognitive science, one thing is certain: we know very little about how our brains work. But through conducting studies and observing […] Read More

DIY Mona Lisa Leonardo da Vinci’s Mona Lisa: it’s a portrait known all over the world, but not […] Read More

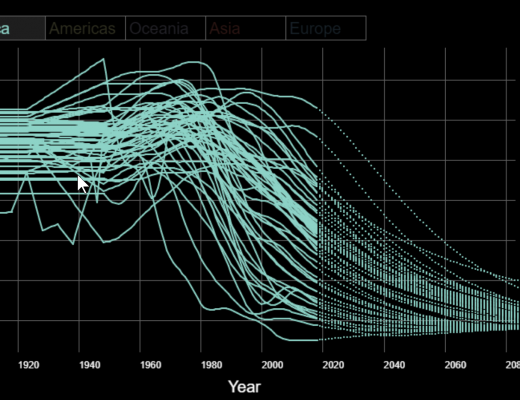
In this short video, Professor Hans Rosling describes how fertility rates have dropped over time (from 6 children per women in 1800 to 2.5 children […] Read More

The OECD PISA (wiki link) made a 2015 study On average across OECD countries in 2015, 73% of students reported that they feel that they […] Read More
We’ve all seen animated movie characters that appear life like in their movements and behavior. Often, their movements are modeled using Motion Capture, where the […] Read More
Can you tell that the yellow and blue blocks are actually aligned? Click the visualization to see the lines! This project is based off of […] Read More
Although we see Massachusetts leading in computer science classes, the state also leads the USA in Average SAT Scores. Second place is Connecticut. Scroll down […] Read More
Computer Science appears in many fields of research. Here’s how far often the word “Algorithm” appears according to Google Scholar of 2012: Indeed, much […] Read More
Check out the most popular programming languages in an easy to use visualization. Click on the graph to change it from weightings based off Google […] Read More